26

I guess the time has come to ask a question on exploiting Mathematica functionality to explore user behavioural patterns on Mathematica.Stackexchange. Most of the community individuals know that Mathematica is the best (?) tool for such purposes, but the problem is to be capable of doing it.
So far ( December 10, 2013) there have been 3130 students, roughly 900 teachers, over 11700 questions etc. in other words: a lot of data to be explored.

There were a few interesting posts mainly by Sjoerd C. de Vries on Stackoverflow e.g.

which might be helpful here.

This question is assumed to trigger discussion on what should be asked in such questions on the main site. I hope it might be constructive for those to ask good and inquiring questions exploring behavioural patterns (for any user) like:

  • ratios of their reputation to number of votes on other's posts (e.g. there are users who gave many answers (and/or questions) but no votes and reversely few answers but many votes)
  • their monthly means of earned upvotes per number of (answers/questions)
  • ratio of silver badges to bronze badges
  • activity on chat
  • reputation per post (if I remember it's been accessible directly on stackexchange)
  • links between users (new functionality for social networks) etc.

Piecies of appropriate code, links to useful posts (e.g. Wolfram|Alpha Personal Analytics for Facebook, The Personal Analytics of My Life), helpful remarks (or anything else) for users who are to ask adequate questions are welcome.

5
  • 1
    Re: ratio of silver badges to bronze badges - this has been one of my favorite metrics for quite a while now. The other metric which I consider quite important is a ratio of accepted answers to all answers. Perhaps, it should be somehow weighted with the vote count for the question, but this I am not sure about. Commented Dec 10, 2013 at 12:09
  • 12
    Interesting. I wonder if one could do some analysis to predict which users might answer a question, based on the question's tags and the time of day. This could evolve into the ultimate mma.se plugin: "Warning! User Behavioural Analysis indicates a 90% probability that this question will be comprehensively answered by Mr Wizard before you finish working on it." Commented Dec 10, 2013 at 16:05
  • 1
    @SimonWoods Well, you know, I don't need any serious analytics to make that exact statement at the end of your comment, and be sure it's a safe bet :) Commented Dec 10, 2013 at 17:21
  • 4
    @SimonWoods one should also be warned of Shifrinisms: "Warning: you might get more than you ever wished for" :D
    – Yves Klett
    Commented Dec 10, 2013 at 18:05
  • 7
    @YvesKlett I think you mean: "PREAMBLE: You might get more than you ever wished for" :D
    – rm -rf Mod
    Commented Dec 10, 2013 at 22:26

2 Answers 2

15

A first step to being able to do analysis with up to date data is to import the data from the API. After that there needs be a framework for working efficiently with the data in Mathematica. In my opinion, the obvious technology for this is SQL. Ultimately all data in the API should be downloaded and stored locally so that it's easy to work with, however I decided to start with just data about users to exemplify.

This code will set up an HSQL database with the 100 users that have most reputation:

data = "items" /. 
   Import["https://api.stackexchange.com/2.1/users?pagesize=100&order=\
desc&sort=reputation&site=mathematica&filter=!9f8L71Vn(", "JSON"];
userColumns = {"accept_rate", "account_id", "answer_count", "creation_date", 
           "display_name", "down_vote_count", "last_access_date", "last_modified_date",  
           "link", "location", "profile_image", "question_count", "reputation", 
           "up_vote_count", "user_id", "view_count"};
Needs["DatabaseLink`"];
JDBCDrivers["HSQL(Standalone)"];
conn = OpenSQLConnection[
           JDBC["HSQL(Standalone)",
           ToFileName[{$UserAddOnsDirectory, "Applications", "DatabaseLink", "Custom"},  
                      "stackexchange"]]];
SQLExecute[conn, "DROP TABLE users IF EXISTS"];
SQLExecute[conn, "DROP TABLE users_badges IF EXISTS"];
SQLCreateTable[conn, "users", {
   SQLColumn["accept_rate", "DataTypeName" -> "Float"],
   SQLColumn["account_id", "DataTypeName" -> "Float"],
   SQLColumn["answer_count", "DataTypeName" -> "Float"],
   SQLColumn["creation_date", "DataTypeName" -> "Float"],
   SQLColumn["display_name", "DataTypeName" -> "Varchar", 
    "DataTypeLength" -> 256],
   SQLColumn["down_vote_count", "DataTypeName" -> "Float"],
   SQLColumn["last_access_date", "DataTypeName" -> "Float"],
   SQLColumn["last_modified_date", "DataTypeName" -> "Float"],
   SQLColumn["link", "DataTypeName" -> "Varchar", 
    "DataTypeLength" -> 256], 
   SQLColumn["location", "DataTypeName" -> "Varchar", 
    "DataTypeLength" -> 256], 
   SQLColumn["profile_image", "DataTypeName" -> "Varchar", 
    "DataTypeLength" -> 256],
   SQLColumn["question_count", "DataTypeName" -> "Float"],
   SQLColumn["reputation", "DataTypeName" -> "Float"],
   SQLColumn["up_vote_count", "DataTypeName" -> "Float"],
   SQLColumn["user_id", "DataTypeName" -> "Float"],
   SQLColumn["view_count", "DataTypeName" -> "Float"]
   }];
SQLCreateTable[conn, "users_badges", {
   SQLColumn["user_id", "DataTypeName" -> "Float"],
   SQLColumn["gold", "DataTypeName" -> "Float"],
   SQLColumn["silver", "DataTypeName" -> "Float"],
   SQLColumn["bronze", "DataTypeName" -> "Float"]
   }];
SQLInsert[conn, "users", 
  userColumns, (userColumns /. data) /. "accept_rate" -> 100];
SQLInsert[conn, 
  "users_badges", {"user_id", "bronze", "gold", "silver"}, 
  Flatten /@ ({"user_id", "badge_counts"} /. data) /. 
   Rule[type_, value_] :> value];

Reputation per up vote (view result here):

TableForm[
 SQLExecute[conn, 
  "SELECT display_name, reputation/up_vote_count as ratio
   FROM users
   ORDER BY ratio ASC"],
 TableHeadings -> {Range[100], {"Display name", "reputation/number of up votes"}}]

Number of silver badges to the number of bronze badges (view result here):

TableForm[
 SQLExecute[conn, 
  "SELECT users.display_name, users_badges.silver/users_badges.bronze as ratio      
   FROM users
   INNER JOIN users_badges
   ON users.user_id = users_badges.user_id ORDER BY ratio DESC"],
 TableHeadings -> {Range[100], {"Display name", "number of silver / number of bronze"}}
]

Number of answers to the number of questions (view result here):

TableForm[
 SQLExecute[conn, 
  "SELECT display_name, answer_count/question_count as ratio 
   FROM users 
   ORDER BY ratio DESC"],
 TableHeadings -> {Range[100], {"Display name", "number of answers/number of questions"}}
 ]

Reputation to the number of posts, that is answers and question (view result here):

TableForm[
 SQLExecute[conn, 
  "SELECT display_name, reputation/(answer_count+question_count) AS ratio
   FROM users 
   ORDER BY ratio DESC"],
 TableHeadings -> {Range[100], {"Display name", "reputation/(number of answers+number of questions)"}}
 ]

Who of the top 100 is still around and who is not? (view result here):

TableForm[
 Map[ (* Don't forget to adapt the next line to your time zone *)
  {#[[1]], DateString@DateList[AbsoluteTime[{1970, 1, 1, 2, 0, 0}] + #[[2]]]} &,
  SQLExecute[conn, 
   "SELECT display_name, last_access_date 
    FROM users 
    ORDER BY last_access_date DESC"]
  ],
 TableHeadings -> {Range[100], {"Display name", "Last access date"}}
 ]

Most popular profile pages (view result here):

TableForm[
 SQLExecute[conn, 
  "SELECT display_name, view_count 
   FROM users 
   ORDER BY view_count DESC"],
 TableHeadings -> {Range[100], {"Display name", "View count"}}
 ]

It will not be possible to check activity in the chat (in this way) because that information is not part of the API.

I would ordinarily be able to do unix timestamp to datetime specification conversion in HSQL directly. I would also not have to use the datatype float for integers to floating point results from division, ordinarily, but something is preventing me from using the appropriate SQL functions, setting the appropriate database settings. I suspect the problem is in the database link.

Update: Using data about answers

Here are some additional stats based on data from the API about answers. First we start by creating a table. This table will not store the display name of users, only their IDs, so the users table that we have already defined is still necessary.

Also note that importing this data involves one API call per member, that is 100 HTTP requests, which means that it isn't instantaneous.

answers[id_] := "items" /. Import["https://api.stackexchange.com/2.1/users/" <> ToString[Round[id]] <> "/answers?pagesize=100&order=desc&sort=activity&site=mathematica&filter=!FqMlbo.zpmvyqEyG)reQTHEWoV", "JSON"];
answersColumns = {"owner", "question_id", "answer_id", "is_accepted", "up_vote_count", "down_vote_count", "creation_date"};
userIDs = Flatten@SQLExecute[conn, "SELECT user_id FROM users"];
SQLExecute[conn, "DROP TABLE answers IF EXISTS"];
SQLCreateTable[conn, "answers", {
   SQLColumn["user_id", "DataTypeName" -> "Float"],
   SQLColumn["question_id", "DataTypeName" -> "Float"],
   SQLColumn["answer_id", "DataTypeName" -> "Float"],
   SQLColumn["is_accepted", "DataTypeName" -> "Boolean"],
   SQLColumn["up_vote_count", "DataTypeName" -> "Float"],
   SQLColumn["down_vote_count", "DataTypeName" -> "Float"],
   SQLColumn["creation_date", "DataTypeName" -> "Float"]
   }];
SQLInsert[conn, "answers", answersColumns /. "owner" -> "user_id", answersColumns /. answers[#] /. {Rule["user_id", id_]} :> id] & /@ userIDs;

How many, out of the 100 most recent answers, have been accepted (view result here):

TableForm[
 SQLExecute[conn, 
  "SELECT users.display_name, COUNT(answers.is_accepted) AS c
  FROM answers
  INNER JOIN users ON users.user_id = answers.user_id
  WHERE answers.is_accepted = True
  GROUP BY users.display_name
  ORDER BY c DESC"],
 TableHeadings -> {Range[100], {"Display Name", "Nr. of accepted"}}
 ]

The average number of "competitive answers" each answer a user has given has (view result here):

competitiveAnswers[id_] := First@First@SQLExecute[conn, 
    "SELECT COUNT(*) 
     FROM answers 
     WHERE question_id IN 
     (SELECT question_id FROM answers WHERE user_id = " <> ToString[id] <> ") AND user_id != " <> ToString[id]
     ]
nrOfAnswers[id_] := First@First@SQLExecute[conn, "SELECT COUNT(*) FROM answers WHERE user_id = " <> ToString[id]]
TableForm[Reverse@SortBy[MapAt[N[competitiveAnswers[#]/nrOfAnswers[#]] &, 
    SQLExecute[conn, "SELECT display_name, user_id FROM users"], {All,2}], Last],
    TableHeadings -> {Range[100], {"Display name", "Number of competitive answers/number of answers"}}
 ]

Another SQL query is this:

SQLExecute[conn, "
    SELECT user_id, COUNT(user_id) 
    FROM answers
    WHERE question_id IN (SELECT question_id 
                          FROM answers
                          WHERE user_id = 731)
    AND user_id != 731 
    GROUP BY user_id"]

My user id is 731, so this query tell me that user 89 has answered four questions that I have also answered, accounting only for the 100 most recent answers I've given. It tells me that user number 1194 has answered one question that I also answered.

Communities!

Thanks to the code belisarius posted in the comments we can find out what different communities, found out using the spectral option with FindGraphCommunities, exist. The weights in the graph between two users is how many of the questions, of the most recent 100 answers user one given, has user two also answered.

r = IntegerPart@
  DeleteDuplicates[
   Flatten[SQLExecute[conn, 
       StringReplace[
        " SELECT X, user_id, COUNT(user_id) FROM answers WHERE \
question_id IN (SELECT question_id FROM answers WHERE user_id = X) \
AND user_id != X GROUP BY user_id", "X" -> ToString[#]]] & /@ userIDs,
     1], (#1[[1]] == #2[[2]] && #1[[2]] == #2[[1]]) &]; g = 
 Graph[UndirectedEdge @@@ r[[All, 1 ;; 2]], 
  EdgeWeight -> Flatten[r[[All, 3]]]]; rul = 
 Rule @@@ SQLExecute[conn, 
   "SELECT user_id,display_name FROM users"]; groups = 
 1. FindGraphCommunities[g, Method -> "Spectral"] /. rul;

CommunityGraphPlot[g, FindGraphCommunities[g, Method -> "Spectral"], PlotLegends -> Placed[Automatic, Below]]
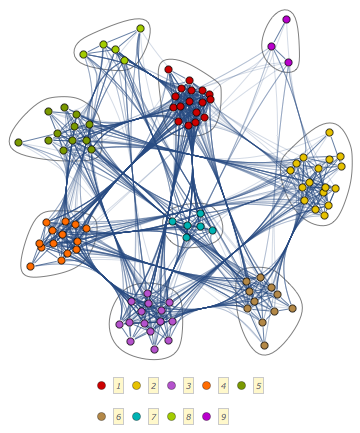
community graph

Where the groups are given by

TableForm[
 StringJoin[Riffle[#, ", "]] & /@ groups,
 TableHeadings -> {Range[Length[groups]], {}}
 ]

View the groups here.

22
  • @Artes I mixed up the column order. It has been fixed now.
    – C. E.
    Commented Dec 12, 2013 at 19:05
  • Thanks again, now it works!
    – Artes
    Commented Dec 12, 2013 at 20:33
  • 1
    Could you include a screenshot of the results for each? For some reason, I can't get it to work right away...
    – rm -rf Mod
    Commented Dec 12, 2013 at 23:11
  • @rm-rf I've added links now.
    – C. E.
    Commented Dec 12, 2013 at 23:51
  • 2
    I fail to grasp the significance of the reputation/up_vote_count statistic. Almost all the people I respect most group in middle of the list. What does it mean for someone to be an outlier?
    – m_goldberg
    Commented Dec 13, 2013 at 5:02
  • 4
    @m_goldberg I agree. I'm not blown away by the usefulness of the silver to bronze ratio either. Several of the people whose answers I like the most are in the bottom half in that list. If we would include more members we would probably see a few people who vote a lot even though they don't have a lot of rep. This shows that they contribute, although in a different fashion, because when you vote you keep the site alive. If all of us had a ratio of about 100 a lot of us would never get any votes and hence no feedback, and the site would look dead. Voting is important to the community.
    – C. E.
    Commented Dec 13, 2013 at 11:35
  • 1
    @m_goldberg It's a useful statistic, when considered along with the number of votes given out. For someone that's only at 500 rep, it's easy to have a good value for the statistic if they vote just 500 times. For a higher rep user it's harder to get a number close to 1 because of their rep.I'll take myself as a simple example – even though I've given ~6k votes, I'd have to have vote 50k times to get to 1! We don't even have that many posts yet. On the other hand, there are regular users — some even 10k+ — who never vote, so they end up at the bottom of the pile.
    – rm -rf Mod
    Commented Dec 13, 2013 at 16:26
  • @Anon yeah, go ahead and demolish one of the few stats I ever took a shine to :D
    – Yves Klett
    Commented Dec 13, 2013 at 19:34
  • @rm-rf. I see your point, but I think it would be more meaningful if total votes (up and down) were counted. Down vote are useful to the community, too.
    – m_goldberg
    Commented Dec 14, 2013 at 8:25
  • Very nice! I hadn't used the HSQL database before, but this is a nice tutorial to start with and it works like a charm. Is the line JDBCDrivers["HSQL(Standalone)"]; necessary BTW? Commented Dec 14, 2013 at 16:21
  • @SjoerdC.deVries Thanks! I took it from an old notebook I had, so I haven't tried removing it, but it's almost certainly superfluous.
    – C. E.
    Commented Dec 14, 2013 at 16:34
  • I like that one before last stat :) p.s. great stuff. :)
    – Kuba
    Commented Dec 14, 2013 at 21:35
  • r = IntegerPart@ DeleteDuplicates[Flatten[SQLExecute[conn, StringReplace[" SELECT X, user_id, COUNT(user_id) FROM answers WHERE question_id IN (SELECT question_id FROM answers WHERE user_id = X) AND user_id != X GROUP BY user_id", "X" -> ToString[#]]] & /@ userIDs, 1], (#1[[1]] == #2[[2]] && #1[[2]] == #2[[1]]) &]; g = Graph[UndirectedEdge @@@ r[[All, 1 ;; 2]], EdgeWeight -> Flatten[r[[All, 3]]]]; rul = Rule @@@ SQLExecute[conn, "SELECT user_id,display_name FROM users"]; 1. FindGraphCommunities[g, Method -> "Spectral"] /. rul Commented Dec 15, 2013 at 22:04
  • 1
    I also have doubts about the usefulness of these metrics. The fact that I rank so highly in most of them definitely arouses a feeling of suspicion... :) Commented Dec 16, 2013 at 0:13
  • @belisarius Nice! I added it to the post.
    – C. E.
    Commented Dec 16, 2013 at 0:21
1

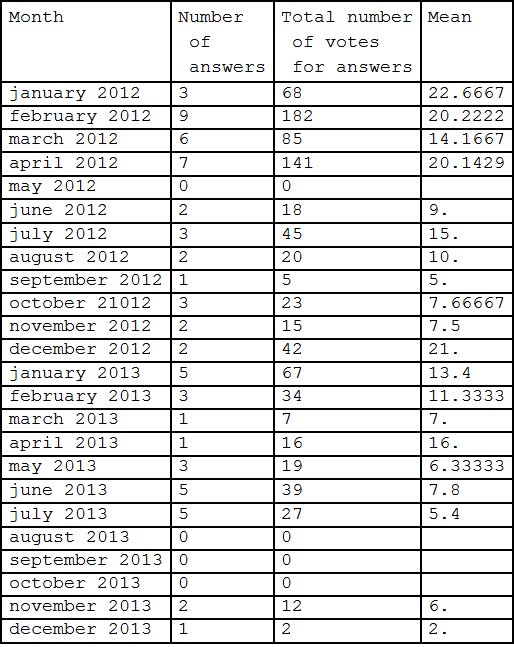
Waiting for others' support let's make the first step taking a look at time characteristics of activity one of the most distinguished Mathematica.Stackexchange users - (you'll be able to guess whose activity we're exploring) The best way would be writing appropriate functions to collect automatically e.g. number of votes to his answers, something along the lines of linked Sjoerd's C. de Vries posts, but to make it clear we start with a pedestrian approach providing a list of total number of votes to his answers in a given month.

distr = {
 {{21, 38, 9}, "january 2012"}, {{5, 66, 8, 15, 17, 10, 25, 18, 18}, "february 2012"},
 {{10, 12, 25, 21, 5, 12}, "march 2012"}, {{5, 13, 13, 10, 11, 31, 58}, "april 2012"},
 {{}, "may 2012"}, {{11, 7}, "june 2012"}, {{11, 29, 5}, "july 2012"}, 
 {{14, 6}, "august 2012"}, {{5}, "september 2012"}, {{8, 9, 6}, "october 21012"}, 
 {{8, 7}, "november 2012"}, {{15, 27}, "december 2012"}, 
 {{17, 15, 12, 15, 8}, "january 2013"}, {{8, 16, 10}, "february 2013"}, 
 {{7}, "march 2013"}, {{16}, "april 2013"}, {{6, 9, 4}, "may 2013"}, 
 {{11, 6, 5, 9, 8}, "june 2013"}, {{1, 5, 4, 8, 9}, "july 2013"}, 
 {{}, "august 2013"}, {{}, "september 2013"}, {{}, "october 2013"}, 
 {{8, 4}, "november 2013"}, {{2}, "december 2013"}};

Let's put it in an appropriate table:

Grid[ Prepend[{ #2, Length @ #1, Total @ #1, If[Length @ #1 != 0, Mean @ #1 // N]}& @@@ 
distr, {"Month", "Number \n of \n answers", 
        "Total number\n of votes \n for answers", "Mean"}], 
      Frame -> All, Alignment -> Left]

enter image description here

Seamless access to such information might be interesting for M.SE users.

3
  • 3
    Just a side note: I'm not quite sure if I feel good with all the possible analytic info displayed in the site or meta. My concern is mostly for users using their real names. How many hours/month they spend on SE sites, for example, could bring up some job/marital/martial problems. Commented Dec 10, 2013 at 16:53
  • 1
    @belisarius True, information may be dangerous. Nonetheless there is no warning on the main nor on the meta "for adults only". On the other hand we could delete eventual posts after some grace period.
    – Artes
    Commented Dec 10, 2013 at 17:02
  • 5
    I think all our habits are freely inspectable using the Tools at data.stackexchange.com anyway...
    – cormullion
    Commented Dec 10, 2013 at 18:52

You must log in to answer this question.

Not the answer you're looking for? Browse other questions tagged .